Guide to Plots | Guide to the Probabilistic Wind Hazard Plots
Guide to the Probabilistic Wind Hazard Plots
About probabilistic wind hazard models
Anyone who has ever looked at predictions from deterministic numerical weather prediction models has likely realized that it is very rare that the predicted conditions exactly match what occurs. Because the atmosphere is a chaotic system, with many scale interactions that are impossible to model with complete accuracy, errors will always occur. Such errors tend to grow in time, causing longer range (e.g., 5-day) forecasts to have degraded skill compared with short-term (e.g., 12 hours) forecasts.
When it comes to ascertaining what impacts a tropical cyclone might have at a specific location (for instance, how high the winds might get), the predictions of deterministic models are often rendered useless beyond a few hours to a couple days. Several specific types of errors are responsible for this. Perhaps the most important type of error is the position (track) error in the predicted center of the cyclone. Even if the model had a perfect prediction of other storm parameters, if the track forecast is off by 50 or 150 miles, the conditions you experience at your location will be drastically different from what the model predicted. Another important type of error is the intensity (the maximum winds found anywhere in the storm). It is notoriously difficult for deterministic models to accurately predicted intensity changes, especially rapid ones. Even if a model has a perfect track forecast, if it has a large intensity error, it could dramatically overpredict or underpredict the maximum windspeed for your location. Finally, size errors are another important source of consternation for predicting local impacts. A storm that becomes much larger than what was predicted could lead to significantly higher wind impacts than a storm that stays small.
But what about ensembles? Ensemble prediction systems are fantastic, because they simulate many of the sources of uncertainty that lead to the types of errors discussed above. However, even the largest ensembles only have about 50 members, which means that the full range of possibilities in a tropical cyclone forecast is not fully sampled. Your location might be in a gap between two forecast scenarios of the ensemble. This leads to considerable variability and uncertainty for trying to ascertain the highest winds that might be experienced at your location. To run an ensemble with a large enough number of ensemble members is still well beyond the available computing power of numerical weather prediction centers, which already have some of the largest computers in the world.
To get around the drawbacks of deterministic models or ensembles, probabilistic wind hazard models use frameworks that simulate the important sources of uncertainty for a very large ensemble (on the order of 1000 members). The techniques and methods used are computationally cheap enough for the model to run very fast compared to a full physics numerical weather prediction model, but still capture the relevant
Real-time hurricane wind hazard models
As of v2.5, TCGP now includes output from two types of wind hazard frameworks, each of which has advantages and disadvantages.
National Hurricane Center (NHC) Wind Speed Probability Product
The NHC Wind Speed Probability Product was developed by NOAA and the Cooperative Institute for Research in the Atmosphere (CIRA) back in the 2000s. NHC began offering outputs from the NHC Wind Speed Probability Product on its website in 2006. The product was updated in 2013. The framework uses a Monte Carlo method to simulate uncertainty around the official NHC forecast for track, intensity, and storm size.
Forecast output period: 5-day (120 h)
Wind exceedance output threshold wind speeds
- tropical storm (39 mph)
- gale-force (58 mph)
- Category 1 hurricane (75 mph)
Advantages and potential benefits
- The outputs from this technique are consistent with the official NHC forecast and average forecast errors, giving it a high degree of consistency.
- The outputs have been calibrated over more than a decade of forecasts.
- The technique uses the Kaplan-DeMaria inland decay model to realistically lower the predicted maximum intensity of the storm as it moves in, according to climatologically-observed values.
- The product incorporates a reduction of wind speed over land using a simple friction reduction factor.
Disadvantages and other limitations*
- The Monte Carlo method of sampling results in an "isotropic" view of uncertainty, meaning that the simulated errors are equal on either side of the parameter of interest.
- As a result, this method cannot represent forecast bifurcations, in which the "true" forecast situation may have a bimodal distribution. A typical track bifurcation scenario occurs under moderate vertical wind shear. If the storm is able to fight off the shear, it may remain intense and recurve to the northeast. If the storm succumbs to vertical wind shear, it may weaken considerably and continue moving westward.
- The technique does not incorporate case-dependent dynamical uncertainty.
- When dynamical forecast uncertainty is large, this technique will be too sharp, overestimating wind hazard near the predicted path of the storm and underestimating the extent of wind risk elsewhere.
- When dynamical forecast uncertainty is smaller than normal, the probabilities of this technique may be too diffuse, underestimating wind hazard near the predicted path of the storm and overestimating the extent of wind risk elsewhere.
*It is noted that CIRA is developing an updated version of the NHC Wind Speed Probability Product which may alleviate some of these disadvantages.
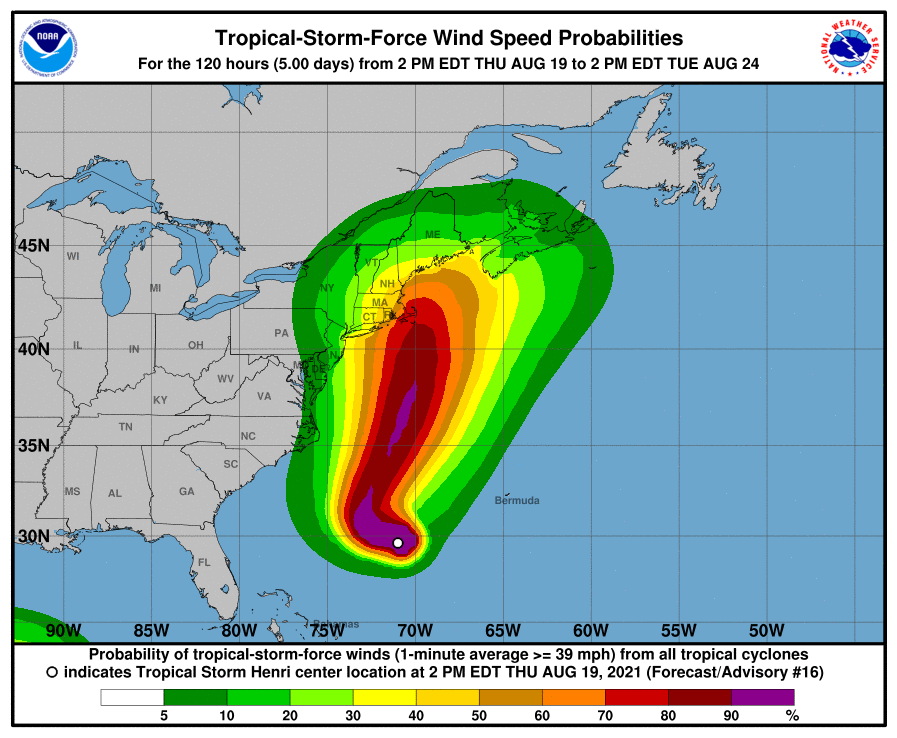
Fig. 1: An example of the NHC Wind Speed Probability Product graphical output for Tropical Storm Henri, initialized at 21 UTC on 19 August 2021. Color contours show the probability that the maximum sustained (1-min average) windspeed at a given location will exceed 39 mph over the 5-day forecast period.
The NHC Wind Speed Probability Product also provides the wind speed probabilities in tabular form for a limited number of specific geographic locations, including significant cities, coastal breakpoints, or islands. The table shows the wind speed probabilities for specific time intervals, as well as the cumulative exceedance probability for the entire 120-h period.
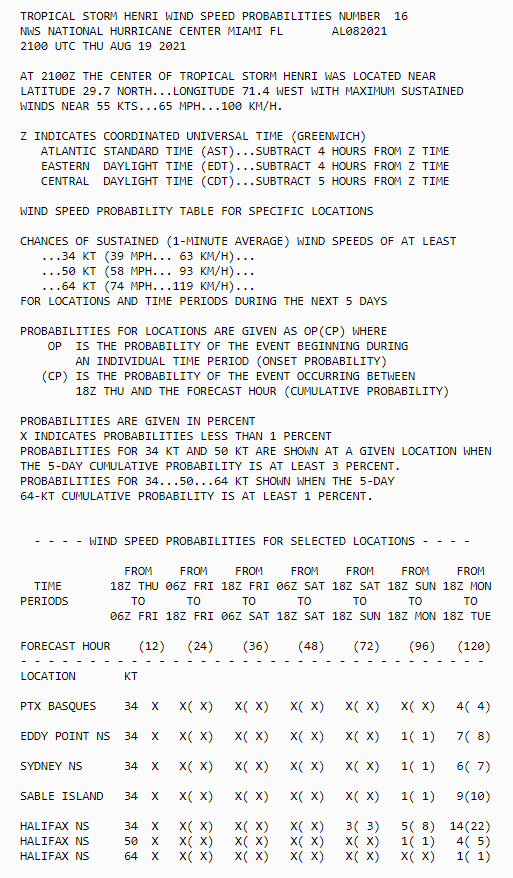
Fig. 2: An example of the NHC Wind Speed Probability Product tabular output tabular output for Tropical Storm Henri, initialized at 21 UTC on 19 August 2021. Table entries show the probability that the maximum sustained (1-min average) windspeed at the indicated location will exceed 39 mph over specfic time intervals and the cumulative probability that winds will exceed the threshold over the entire 5-day forecast period.
TCGP currently links to the NHC Wind Speed Probability Product via external links to the product on NHC's website. In the future, TCGP plans to archive these plots as it does for all of the TCGP-generated content. For more information about the NHC Wind Speed Probability Product, please see the technical documentation from NHC's website.
Forecasts of Hurricanes using Large-ensemble Outputs (FHLO)*
FHLO is a new breed of wind hazard framework that heavily leverages the rich information contained in global ensembles. Such ensembles represent the flow-dependent uncertainty in the atmosphere that includes many factors beyond just the track, intensity, and size of a tropical cyclone. These include multiple and diverse representations of the evolution of both medium-scale and large-scale weather patterns that are important for the tropical cyclone forecast. To use this information, FHLO first uses a synthetic track model to "bootstrap" the tracks of the underlying global ensemble. FHLO computes 1000 tracks that have statistical properties that are similar to the underlying global ensemble, but which fill in the gaps, representing the diverse range of possibilities with regard to recurvature, speed, and land interaction. Next, FHLO samples the atmospheric and ocean fields important for the intensity forecast, such as the degree of moist or dry air surrounding the storm, the upper limit of how intense a storm can get in a given area, and the environmental vertical wind shear. FHLO then runs a simple intensity emulator for each of the 1000 tracks, taking into account whether the storm is over water or land. This allows it to treat the uncertainty related to track errors and whether the storm goes over land. The result is 1000 physically realistic simulations of the storm's intensity, which are consistent with the large-scale information provided by the global ensembles. Finally, FHLO runs a wind model on each of the 1000 simulated storms, which allows computation of the probability that the wind will exceed a given value for any given location. TCGP displays the resulting probabilistic wind exceedance plots as maps, in which the contours show the probability that the wind will exceed a given windspeed threshold.
Forecast output period: 7 days (144 h)
Wind exceedance output threshold wind speeds
- tropical storm (39 mph)
- gale-force (58 mph)
- Category 1 hurricane (75 mph)
- Category 2 hurricane (96 mph)
- Category 3 hurricane (111 mph)
- Category 4 hurricane (130 mph)
- Category 5 hurricane (157 mph)
Advantages and other potential benefits
- FHLO provides case-dependent, dynamically-determined uncertainty. Because FHLO is not tied to average error distributions, it is capable of providing increased sharpness in its probabilistic forecasts when the global ensembles indicate that dynamical uncertainty is lower than typical, and more diffuse probabilities when uncertainty is higher than typical.
- FHLO includes a rich amount of information from underlying global ensemble and can represent forecast situations involving bifurcations or bimodal distributions.
- This may help FHLO to perform well in situations involving moderate environmental vertical wind shear, in which a storm may either fight off the shear and recurve as a more intense storm, or become vertically decoupled and continue westward with weaker winds.
- Because FHLO is not tied to forecast constraints, it may better able to represent rapid intensification scenarios.
- FHLO provides outputs through 7 days, allowing for longer range planning than the standard 5-day forecast period.
- FHLO provides graphical (spatial) outputs for a number of wind speed thresholds higher than Category 1, allowing for better understanding of the risk of extreme winds.
- FHLO provides pointwise wind hazard outputs for any given location, allowing wind hazard to be localized for users who may be far from cities or coastal breakpoints.
Disadvantages and other limitations
- FHLO is currently formulated as a late model, and because it must wait for the fields of the global model to arrive, it's outputs are typically not available until 8 or 9 hours after the initialization time. This means the forecast is already somewhat old by the time it comes out. (The improved predictability provided by the global ensemble information may negate any negative influence caused by this factor, however.)
- FHLO does not yet include any influence from the NHC official forecast, so it could show a forecast that is inconsistent with the official forecast.
- FHLO's FAST intensity module may not do very well for tropical depressions and tropical storms under about 50 kt. There is an over intensification bias for weak storms, where some of the assumptions in axisymmetric TC theory are not the most appropriate.
- FHLO's intensity module was designed to predict the intensity of tropical cyclones in the tropics and subtropics. It has not yet been adapted to handle systems undergoing extratropical cyclones. This results in a negative intensity bias for storms poleward of 40 degrees. Additionally, FHLO's wind model has not been adapted to handle the wind field expansion that can occur during extratropical transition. Users in high latitude locations such as New England or Canada should use FHLO's wind probability outputs with caution, as they may underpredict the wind speed in these regions.
- FHLO does not yet include any special treatment of land in its probabilistic wind speed outputs. While FHLO has been validated over water, it very likely has a considerable high bias over land. To correct for the lack of land friction, users's in inland areas should treat FHLO's outputs as representing the probability of exceedance for the maximum wind gust over land, rather than sustained winds. Over water, or in areas with coastal exposure, the outputs can be taken as representing sustained winds.
More information about FHLO, including technical details, acknowledgments, and references, are provided on the FHLO model documentation page. TCGP currently provides outputs from two different flavors of FHLO, as described below.
FHLO-ECMWF
The FHLO-ECMWF outputs are generated by a FHLO run that uses the European Centre for Medium-range Weather Forecasting Ensemble Prediction System as the underlying ensemble. Because the standard ECMWF EPS outputs are only available twice a day (at 00 and 12 UTC), the FHLO-ECMWF outputs will only be available for forecasts initialized at those times. Because of the considerable length of time it takes to run the ECMWF ensemble, FHLO-ECMWF outputs are typically available 10.5 - 11.5 hours after initialization time. The ECMWF tends to be a very reliable ensemble, and the FHLO-ECMWF outputs are often superior to the FHLO-GEFS outputs (described below).
FHLO-GEFS
The FHLO-GEFS outputs are generated by a FHLO run that uses the NOAA Global Forecast Ensemble System (GEFS) ensemble prediction system as the underlying ensemble. GEFS ensemble outputs are available four times a day (at 00, 06, 12, and 18 UTC), so the FHLO-GEFS are likewise updated every 6 hours. The FHLO-GEFS outputs are typically available 9 - 10.5 hours after initialization time. The GEFS ensemble underwent significant improvements in 2020 and is a leading global ensemble. The GEFS ensemble tracks may still be somewhat underdispersive, however, so the FHLO-GEFS outputs may somewhat overpredict wind speed probabilities near along the center of the track distribution, with some underprediction at the edges of the distribution.
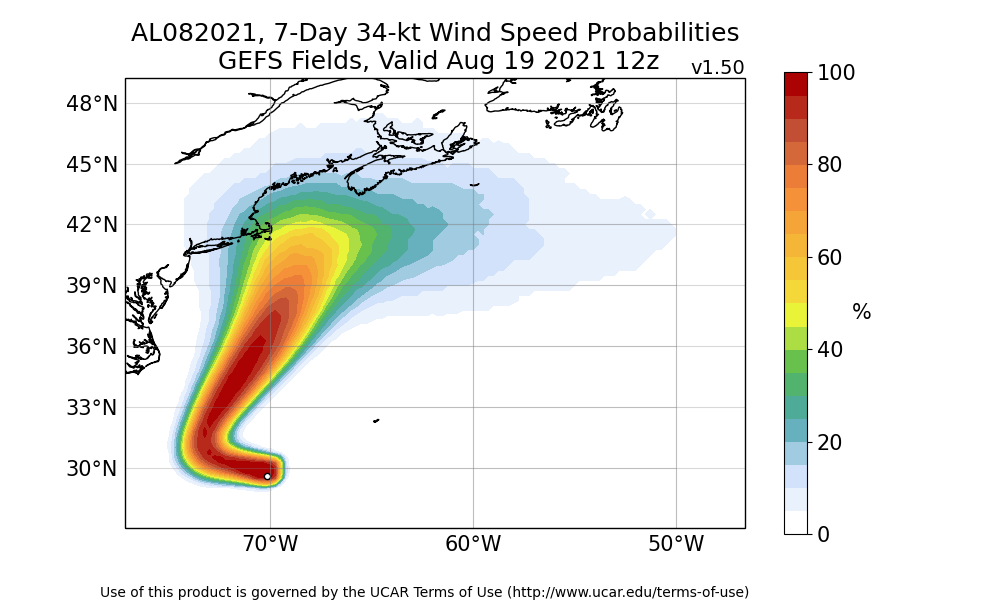
Fig. 3: An example of the FHLO-GEFS graphical output for Tropical Storm Henri, initialized at 12 UTC on 19 August 2021. Color contours show the probability that the maximum sustained (1-min average) windspeed at a given location will exceed 39 mph over the 7-day forecast period.
*The data incorporated herein is generated from the use of the Massachusetts Institute of Technology (MIT)’s Forecasts of Hurricanes Using Large-ensemble Outputs (FHLO) version 1.3, © MIT, used with permission. All Rights Reserved.
This page was last updated by Jonathan Vigh on 23 August 2021.<