Guide to Plots | Guide to the Curve Boxplot Visualizations
Guide to the Curve Boxplot Visualization
About the Curve Boxplot Visualization
The curve boxplot is an exploratory data analysis tool that has been proposed to analyze and visualize an ensemble of pathlines. Analogous to the conventional boxplot, the curve boxplot provides the statistical summarization of an ensemble in terms of its main features: the most representative member (i.e., median), quantile information, and potential outliers.
The curve boxplot is constructed based on the concept of ordering or sorting. While the concept of ordering is trivial for an ensemble of univariate values (i.e., sorting the values from the smallest to the largest), the concept of ordering is not trivial for multidimensional data (e.g., curves or pathlines). Therefore, an ensemble of pathlines is ordered using a generalization of the concept of data depth. Data depth is a statistical concept that provides a center-outward ordering of an ensemble. Data depth provides sensitivity to subtle features such as shape and speed, and hence, can be a powerful tool for robust summarization of an ensemble of pathlines.
You can learn more about different generalizations of boxplot for multidimensional data by consulting the original paper that proposed the idea of curve boxplot ( http://www.cs.miami.edu/home/mirzargar/papers/curve_boxplot.pdf) and the Wikipedia page that goes into details of its precedent: contour boxplots ( https://en.wikipedia.org/wiki/Contour_boxplot).
The color coding of the curve boxplot visualization based on the conventional boxplot is demonstrated below.
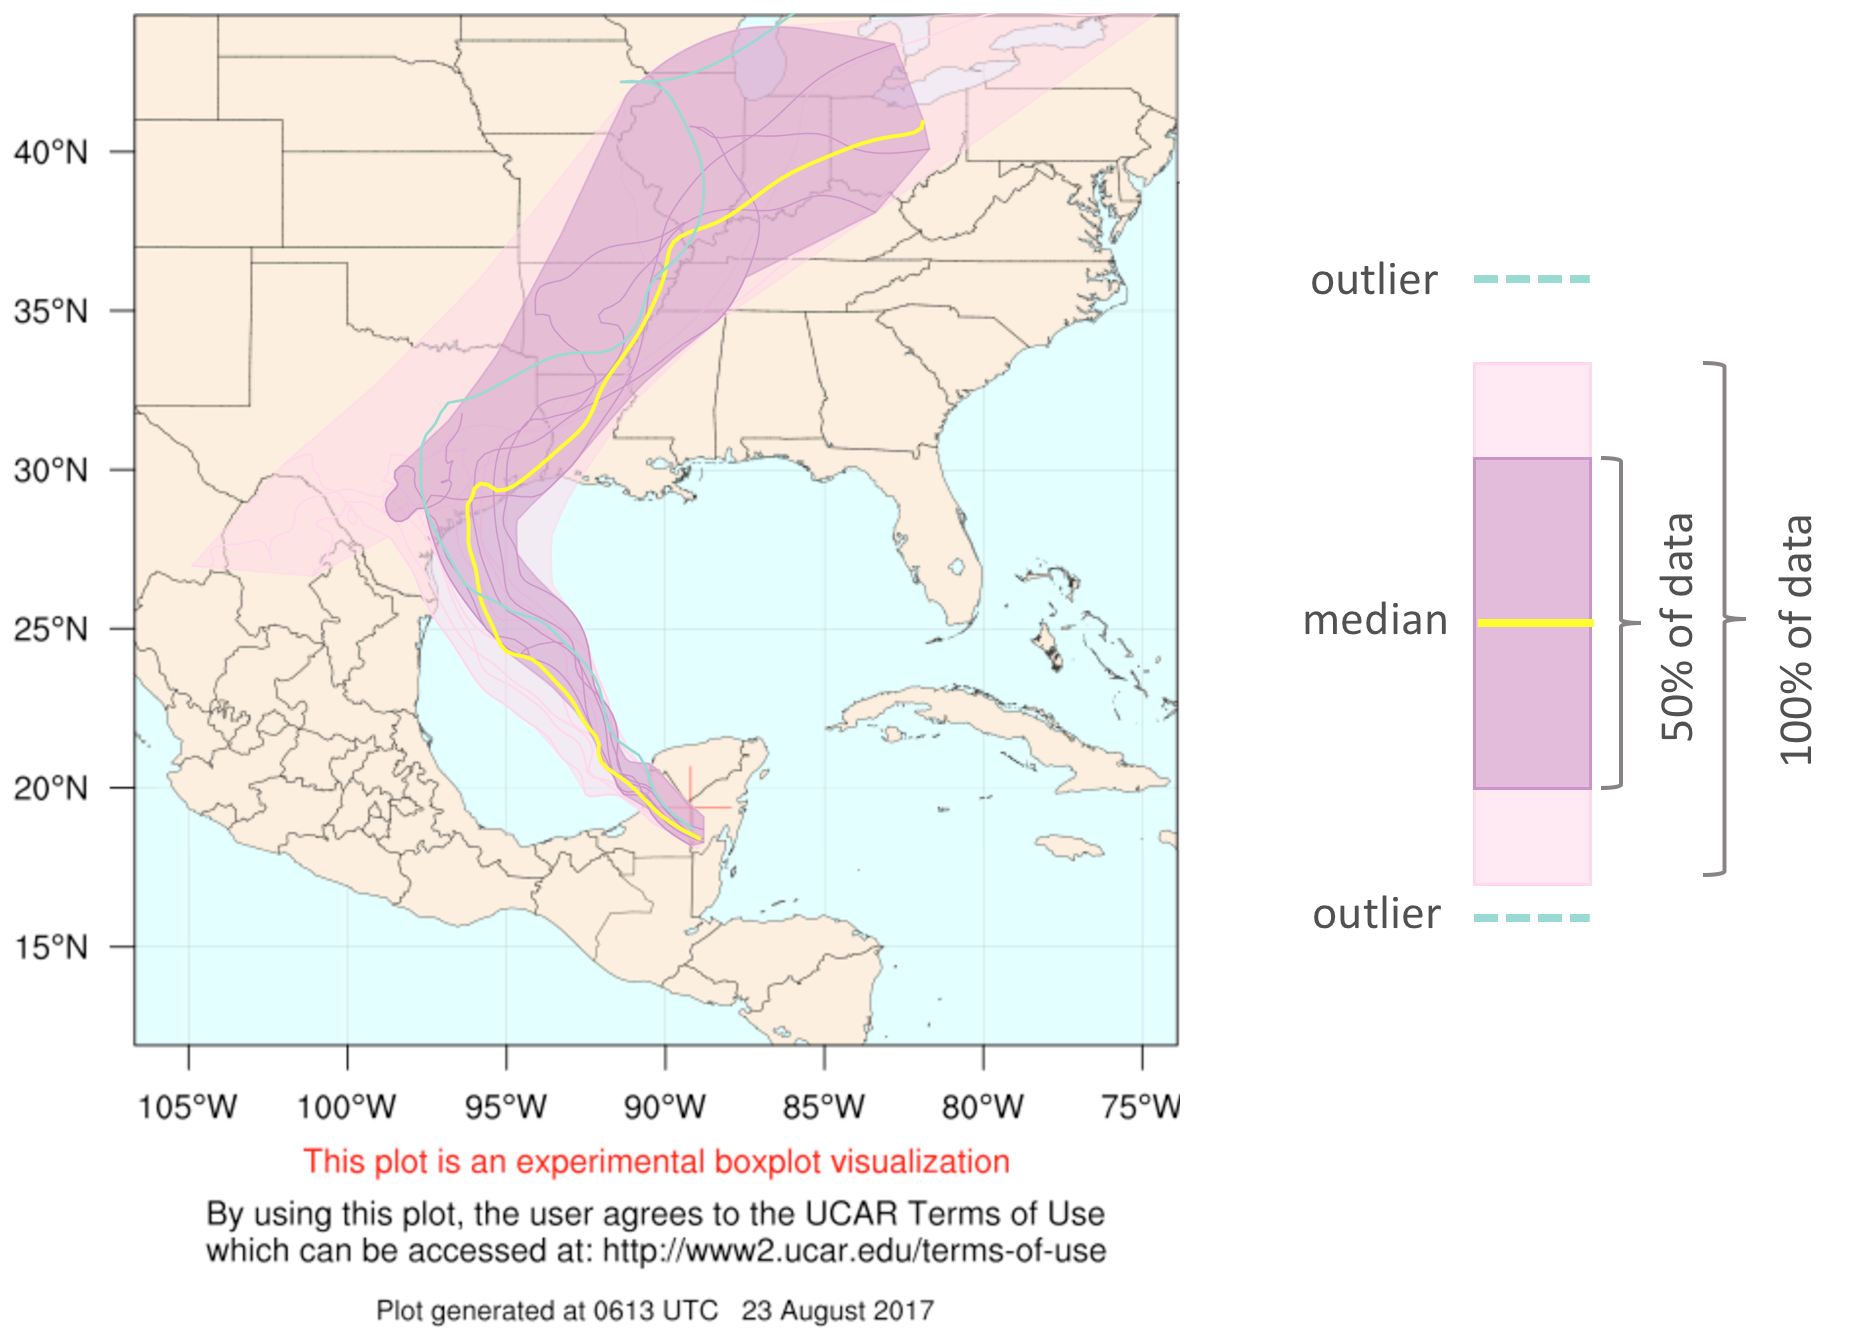
An example boxplot visualization, showing the median track (yellow), the central envelope (dark purple shading), the outer envelope (light purple shading), and the outlier tracks (blue).
References
Details on How the Curve Boxplot Technique is Applied to Ensemble Prediction Systems (EPS)
The curve boxplot visualization is currently only generated for the GFS EPS (GEFS; to learn more about the GFS EPS, please click here). We plan to apply the technique to other EPSs in the near future, including the Canadian GEMS EPS and the U.S. Navy's NAVGEM EPS.
To apply the technique to EPS data, only the perturbed ensemble members of a given EPS are included in the analysis (for the GEFS, these include TECH IDs of APnn). No other control or ensemble mean tracks are included. Any ensemble members with tracks of less than five points are excluded from the analysis. Finally, the analysis only includes forecast lead-times through 168 hours (7 days).
Acknowledgments
The curve boxplot visualization technique was developed by Mahsa Mirzargar during her postdoctoral appointment at the University of Utah. The groundwork on curve boxplots was laid through support from the National Science Foundation (NSF) grant IIS-1212806.
The curve boxplot was implemented in the Tropical Cyclone Guidance Project on 23 August 2017 by Jonathan Vigh and Mahsa Mirzargar. The integration of the curve boxplot code into the the real-time system was partially funded by the University of Miami Provost Research Award and through support from the Research Applications Laboratory Opportunity Fund (RALOF) for the proposal entitled "Development Toward a Real-time Tropical Cyclone Risk Calculator", $29,241, 01 July 2017 - 30 June 2018.
Frequently asked questions
This section attempts to answer questions that users may have. If you have a question about this product, please feel free to e-mail it to jvigh@ucar.edu.